Distributed systems can generate more telemetry than a team can afford to retain or effectively investigate. Adding services, retries, and background jobs multiplies spans even when customer traffic barely changes. A practical observability strategy needs an explicit decision about what to collect, what to retain, and how to recognize losses in the collection pipeline.
OpenTelemetry provides a useful place to implement that decision outside application business logic. This guide proposes a starting architecture, not a universal sampling percentage or a promise of a fixed cost reduction.
Measure the billable workload first
Record incoming spans per second, exported bytes, average spans per trace, and backend retention. Separate application traffic from health checks and synthetic probes. Determine whether the backend charges by ingestion, storage, indexed fields, or a combination.
Also measure Collector CPU and memory. Reducing backend ingestion by moving work into a Collector does not make that work free. A useful baseline includes the infrastructure cost of collection and the time engineers spend locating a representative failed request.
Choose where sampling decisions happen
Head sampling decides near the start of a trace and has relatively little state. Tail sampling waits for spans and can use observed outcomes such as error status or latency. However, it cannot recover spans that an upstream SDK has already discarded.
The tail sampling processor documentation describes policy configuration and the buffering involved. Confirm that your Collector distribution includes this processor and validate configuration against the exact release you deploy.
Route each trace to one sampling decision
A normal round-robin load balancer can split spans from one trace across several sampling instances. Each instance then sees only part of the request. Route by trace ID before the sampling tier so that related spans converge on the same decision maker.
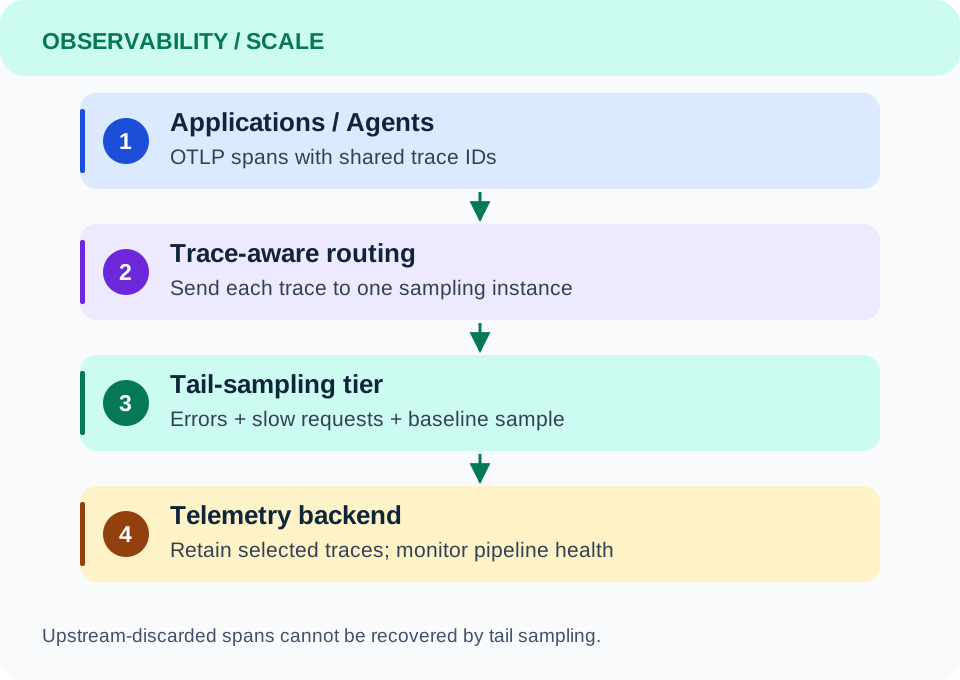
The OpenTelemetry gateway deployment guide describes this arrangement using a load-balancing exporter ahead of tail-sampling Collectors. Scaling that tier needs care because changing instance membership can affect trace placement.
Start with a small, understandable policy
An initial policy can keep traces with an error status, traces exceeding a latency threshold, and a small baseline sample of the rest. This is an illustrative processor fragment, not a complete Collector configuration:
processors:
  tail_sampling:
    decision_wait: 15s
    num_traces: 50000
    policies:
      - name: errors
        type: status_code
        status_code:
          status_codes: [ERROR]
      - name: slow-requests
        type: latency
        latency:
          threshold_ms: 1500
      - name: baseline
        type: probabilistic
        probabilistic:
          sampling_percentage: 5
Wire the processor into a traces pipeline with receivers and exporters. For these simple policies, matching any policy can retain a trace; the baseline is not a five-percent cap on total export volume. During an incident, an error policy may retain much more traffic than usual.
The values above are examples. Choose the decision window from observed span arrival delays, including asynchronous work. Estimate the active trace count from new traces per second multiplied by the decision window, then allow headroom and load-test memory use. Trace count alone is insufficient because traces have different numbers and sizes of spans.
Watch the collector as a production service
Track receiver refusals, exporter failures, queue pressure, restarts, and sampling decisions using metrics exposed by your deployed version. Place memory protection early in the pipeline, configure bounded queues and retries, and decide what should happen during a backend outage.
Keep sensitive request bodies and credentials out of telemetry at the source. Apply attribute removal before export where needed. Sampling is a volume control, not a privacy boundary.
Roll out against debugging outcomes
Canary the pipeline for one service. Compare exported volume, Collector resource use, trace completeness, and whether known errors remain discoverable. Inject a controlled failure and a slow request, then locate both in the backend.
Retain unsampled request counters or other suitable service metrics for rate and availability calculations. A trace dataset deliberately biased toward failures should not be treated as an unbiased error-rate measurement.
Expand only after the canary meets explicit criteria: representative traces are useful, collection remains stable during a burst, and actual billed ingestion improves. Revisit the policy when traffic shape or service ownership changes.