Monitoring is not a nice-to-have. It's the difference between finding out about an outage from your users and catching it before anyone notices. Here's how I set up monitoring that actually works in production.
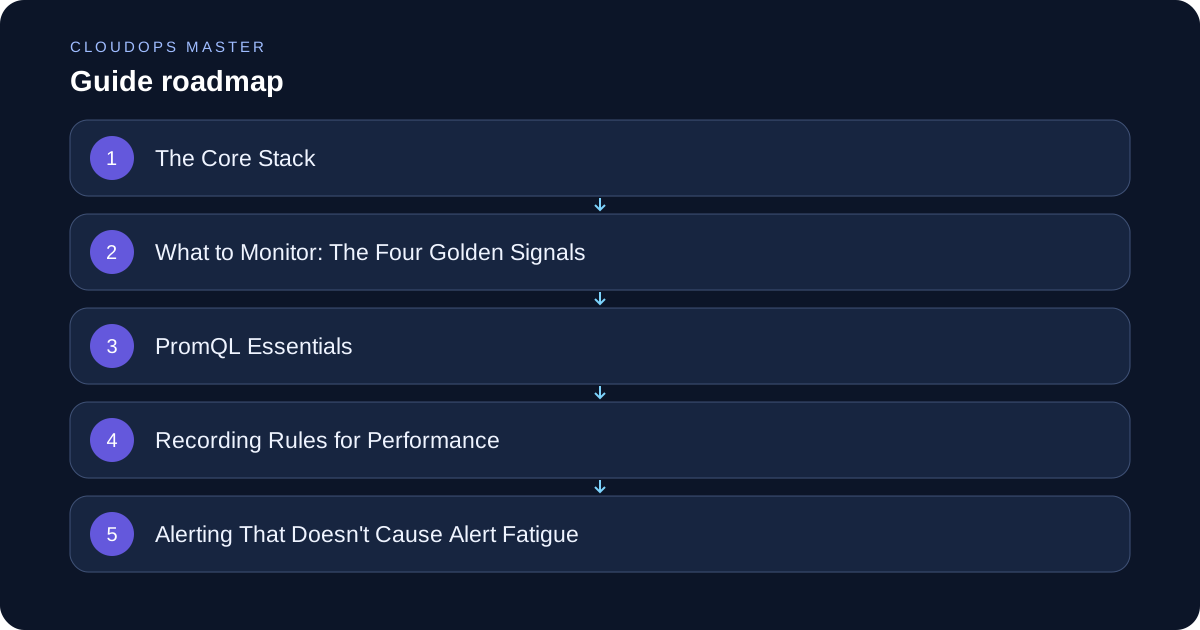
The Core Stack
The combination I use on almost every project:
- Prometheus — metric collection and storage, powerful query language (PromQL)
- Grafana — dashboards and visualization
- Alertmanager — routing and deduplication of alerts
- Node Exporter — host-level metrics (CPU, memory, disk, network)
- kube-state-metrics — Kubernetes object state metrics
In Kubernetes, I deploy this with the kube-prometheus-stack Helm chart — it sets up everything with sensible defaults in one command.
helm repo add prometheus-community https://prometheus-community.github.io/helm-charts
helm install kube-prometheus-stack prometheus-community/kube-prometheus-stack \
  --namespace monitoring \
  --create-namespace \
  --values monitoring-values.yaml
What to Monitor: The Four Golden Signals
Google's SRE book defines the four golden signals. These are the minimum for any production service:
1. Latency — How long requests take. Track both successful and failed requests separately. A fast error is misleading.
2. Traffic — How much demand is hitting your system. Requests per second, messages processed, etc.
3. Errors — Rate of failed requests. Include both explicit failures (5xx) and implicit ones (wrong data, timeouts).
4. Saturation — How "full" your service is. CPU, memory, queue depth, connection pool usage.
PromQL Essentials
PromQL takes time to learn but it's worth it. Here are the patterns I use most:
# HTTP error rate (percentage of 5xx over all requests)
sum(rate(http_requests_total{status=~"5.."}[5m]))
/
sum(rate(http_requests_total[5m])) * 100

# 95th percentile request latency
histogram_quantile(0.95,
  sum(rate(http_request_duration_seconds_bucket[5m])) by (le)
)

# Memory usage percentage per pod
container_memory_working_set_bytes{container!=""}
/ container_spec_memory_limit_bytes{container!=""}
* 100

# CPU throttling (bad for latency)
rate(container_cpu_cfs_throttled_seconds_total[5m])
/ rate(container_cpu_cfs_periods_total[5m]) * 100
Recording Rules for Performance
Complex PromQL queries are expensive to compute on every dashboard load. Use recording rules to pre-compute them:
# prometheus-rules.yaml
groups:
  - name: api.rules
    interval: 30s
    rules:
      - record: job:http_requests:rate5m
        expr: sum(rate(http_requests_total[5m])) by (job, status)

      - record: job:http_request_duration_p95:rate5m
        expr: |
          histogram_quantile(0.95,
            sum(rate(http_request_duration_seconds_bucket[5m])) by (job, le)
          )
Recording rules also make dashboards much faster to load.
Alerting That Doesn't Cause Alert Fatigue
The worst outcome for monitoring is alert fatigue — engineers stop paying attention because there are too many noisy, low-value alerts.
Rules for good alerts:
- Every alert must be actionable — if you can't do anything about it, it's not an alert, it's a metric to watch
- Page only for things affecting users — save email/Slack for warnings, use PagerDuty for true emergencies
- Include runbook links — every alert should link to a runbook explaining what to do
# alertmanager-rules.yaml
groups:
  - name: api.alerts
    rules:
      - alert: HighErrorRate
        expr: |
          sum(rate(http_requests_total{status=~"5.."}[5m]))
          / sum(rate(http_requests_total[5m])) > 0.05
        for: 2m
        labels:
          severity: critical
        annotations:
          summary: "High HTTP error rate on {{ $labels.job }}"
          description: "Error rate is {{ $value | humanizePercentage }} over last 5 minutes"
          runbook: "https://runbooks.internal/high-error-rate"

      - alert: PodCrashLooping
        expr: rate(kube_pod_container_status_restarts_total[15m]) > 0
        for: 5m
        labels:
          severity: warning
        annotations:
          summary: "Pod {{ $labels.pod }} is crash looping"
Grafana Dashboard Design
A good dashboard tells a story at a glance. Structure it in layers:
Row 1 — Overview: Traffic, error rate, latency P95, uptime. These should be green or red at a glance.
Row 2 — Resources: CPU, memory, disk I/O per service.
Row 3 — Kubernetes: Pod status, restarts, HPA scaling events.
Row 4 — Business metrics: Active users, orders/minute, whatever matters to your application.
Use Grafana's alert annotations to mark alert firings on time series graphs — you can instantly see what changed when an incident happened.
Long-Term Metric Retention
Prometheus default retention is 15 days. For longer storage, use:
- Thanos or Cortex — for multi-cluster, high-availability Prometheus with object storage (S3/GCS)
- Grafana Mimir — horizontal scaling for Prometheus-compatible metric storage
For most teams, Thanos with an S3 backend is the right call. It adds about 2 hours of setup and gives you a year of metrics for cents.
The investment in proper monitoring pays for itself the first time you catch an issue before it becomes an incident.